
If you’re thinking of buying a website and you’re in the due diligence phase, one of the most important things you can do is review the site’s Google Analytics. There are countless pieces of information that you can glean from Google Analytics; understanding these can mean the difference between being successful and getting scammed.
Table of Contents
- Getting started doing due diligence with Google Analytics
- Using my due diligence worksheets
- Interpreting Google Analytics reports
- What to watch out for with Google Analytics
- Download the complete Website Investing Beginner’s Kit FREE
- Key points
Getting started doing due diligence with Google Analytics
Google Analytics is an important tool that can be used in pre-offer due diligence. There are a lot of different characteristics of a website that can be determined using Google Analytics.
If you haven’t used Google Analytics much, it’s a good idea to get an overview of all of the reports and features, and how they are defined. The Google Analytics Academy introduction course — although a bit out of date — is a good starting point.
You should have a good basic understanding of Google Analytics before reading this section. Different versions of Google Analytics have reports in different places. Also, the look of certain reports are different.
Using my due diligence worksheets
I have developed many due diligence tools over the time I’ve been investing in websites. The most important one is the Due Diligence Overview worksheet, which is available for FREE by filling out the form below. This worksheet is a crucial starting point to performing a thorough due diligence analysis on a website.
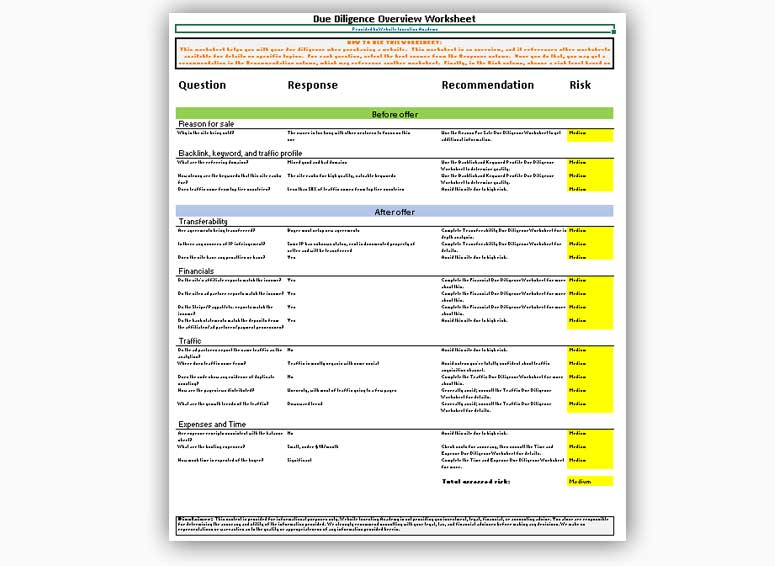
This particular worksheet is an overview, but I also have in-depth due diligence worksheets for Google Analytics available as well.
Interpreting Google Analytics reports
In this article, we look at the latest version of Google Analytics. If an older version is installed on the site you’re evaluating, you can search online for how to see a similar report.
Before getting started, don’t be surprised if a site doesn’t have data for some of these reports. Content sites often don’t have tracking set up for certain metrics like conversion or monetization. These can be useful to help you increase revenue if you purchase the site, but most owners will simply ignore them.
User report
There are several important due diligence nuggets that you can glean from the User report in Google Analytics.
Location of users
Websites with millions of users per month often make far less than sites with only a couple of thousand users. That’s partially due to the location of the users. Users from certain countries simply aren’t that valuable to advertisers and affiliates than users from other countries.
Therefore, one of the most important things to check when performing due diligence with Google Analytics is the Geo report. This report tells you where users are located. To access this report in the latest version of Google Analytics, go to Reports in the left sidebar, then click Users > Demographics > Demographics Details.
If you have an older version of Google Analytics installed, the location may be different, but the report information is similar.
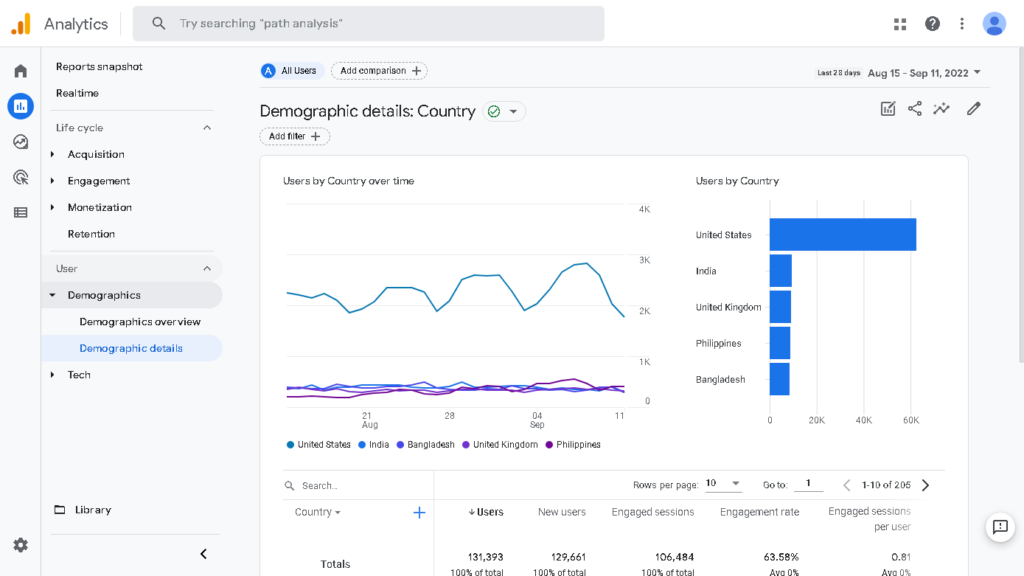
If you are evaluating an ad supported website, in this report, it’s best to see most users coming from U.S., Canada, Western Europe, Australia, and New Zealand. These are countries where the advertising rates are the highest.
Users from South/Southeast Asia tend to be worth little to advertisers. Therefore when estimating the income of a site, you can simply ignore the number of users from these areas.
Affiliate websites
If you’re evaluating an affiliate website, this report is even more important. Often, partner stores will only sell in certain regions. If the site is an affiliate for a certain store, users that come from locations where the store doesn’t operate are worthless.
For example, suppose you are looking at a site that makes money through the Amazon Associates affiliate program. Amazon is a great program for U.S. users. It can also be a good program for European, Canadian, and Australian users (although the programs are separate so bookkeeping is more difficult).
But if you have a lot of users from India, you’re out of luck. Unless you have a bank account that’s located in India, you won’t be able to earn any commission from those users. And if some of your users are in the Philippines, there’s no Amazon affiliate program at all for those users.
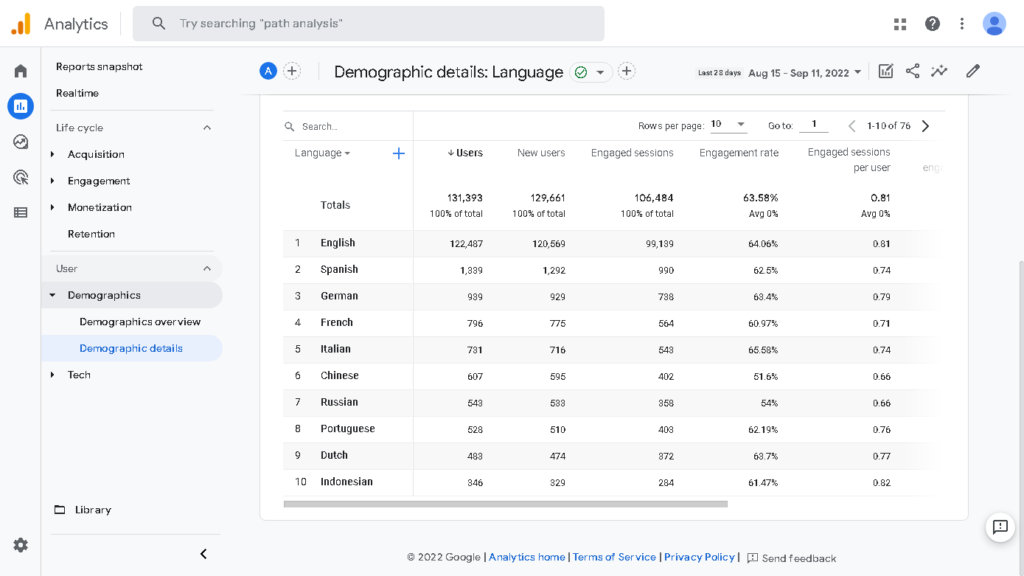
Languages of users
The language report is worth looking at to help protect from fraudulent users. Under User in the left sidebar, click Demographics overview. Then go to the right pane and in the language panel, click View languages.
The languages report should track pretty well with the languages that the site is written in. If the site is purely in English, and 50% of the users in this report speak Chinese, then there’s something wrong. This often suggests paid fake traffic that the owner is sending to the site in order to inflate pageviews.
In addition to languages and locations, it’s worth checking the rest of the Demographics reports to see if there’s anything that looks strange. If you see something that just doesn’t seem right, ask the seller about it.
Acquisition report
The acquisition report tells you about how users are acquired. To view this report in Google Analytics 4, go to the Reports tab, and then click Acquisition.
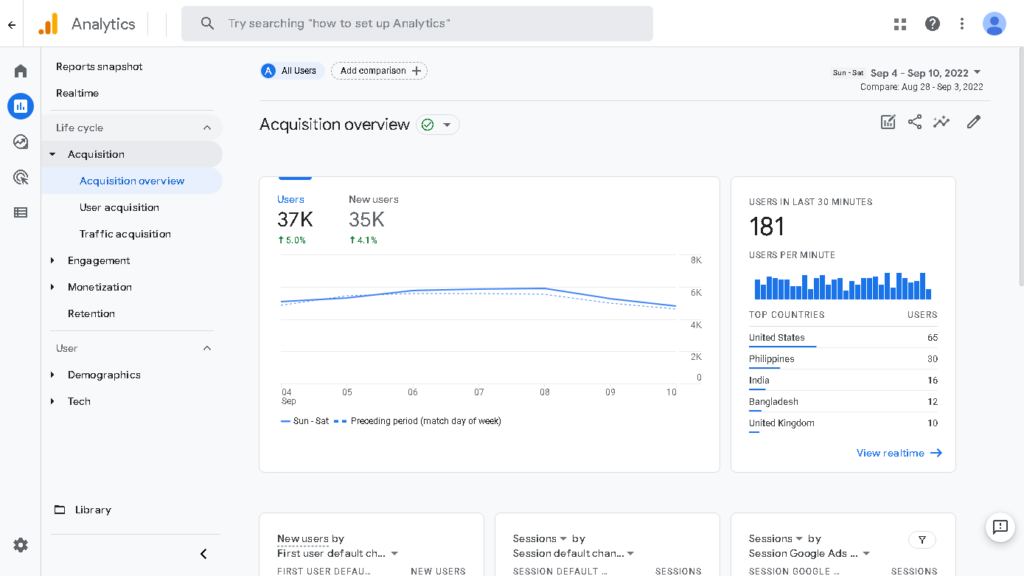
The first thing to do with this report is go to the right pane and click View user acquisition in the New users panel. This report tells you what source the new users are coming from. In general, when buying a content or affiliate website, you want the vast majority of users to come from Organic Search.
If the site is getting a lot of traffic through Organic Social, you should carefully analyze the social media sites for the website. It’s possible that the owner is doing a lot of work promoting the site on social media. To maintain the traffic, you would have to do the same. If the owner has a large following on social media, you might not be able to reproduce the owner’s success through social.
If the site gets a lot of traffic via Referral or Direct, you will want to ask the seller why. It may be that the site has a brand that’s well known and people will go directly to it. Or that many of the users come from a legitimate referral source. However, it is also possible that this traffic is fraudulent.
View referrals
If you do see a lot of referral or direct traffic, you should look deeper into where that traffic is coming from. You can do that in Google Analytics 4 using an exploration.
When doing due diligence with Google Analytics, this is an important report to check. To get to it, click on the Explore tab in the left sidebar in Google Analytics. You will see a page with the title Explorations. Click Blank to create a new one.
On the exploration screen, click the + next to Dimensions, and the expand Page / Screen and check the box next to Page referrer. Click Import to continue.
Then, click the + next to Metrics, and expand User. Check off Active users and then click the Import button again.
Finally, under Rows, click Drop or select dimension and choose Page referrer. Under Values, click Drop or select metric and choose Active users. The page should then look like this:
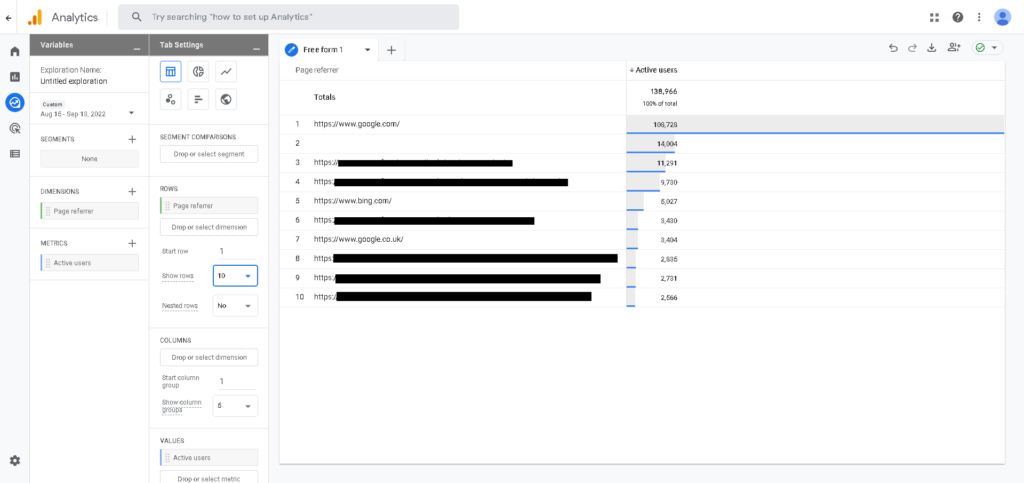
The referring URLs in this report gives you a good sense of where the site’s users are coming from. If there are URLs that seem suspicious, follow up with the seller or broker.
Engagement report
Engagement and bounce rate are things to be aware of. But you don’t need to be overly concerned with them when performing due diligence with Google Analytics. I typically like to see engagement times of one minute or more. However, I don’t reject sites that don’t meet that threshold.
Ideally, you want to see higher engagement times, and lower bounce rates. But a site with lower engagement times or higher bounce rates can still be valuable. An affiliate site, for instance, may be getting users to click over to the affiliate quickly and therefore would register a lower engagement time.
In the example above, if you purchased the site, you could optimize Google Analytics to register a conversion event when a user clicks an affiliate link, and Google Analytics would then register that action as an engagement. However, most site sellers won’t have done this, so the engagement metric is misleading.
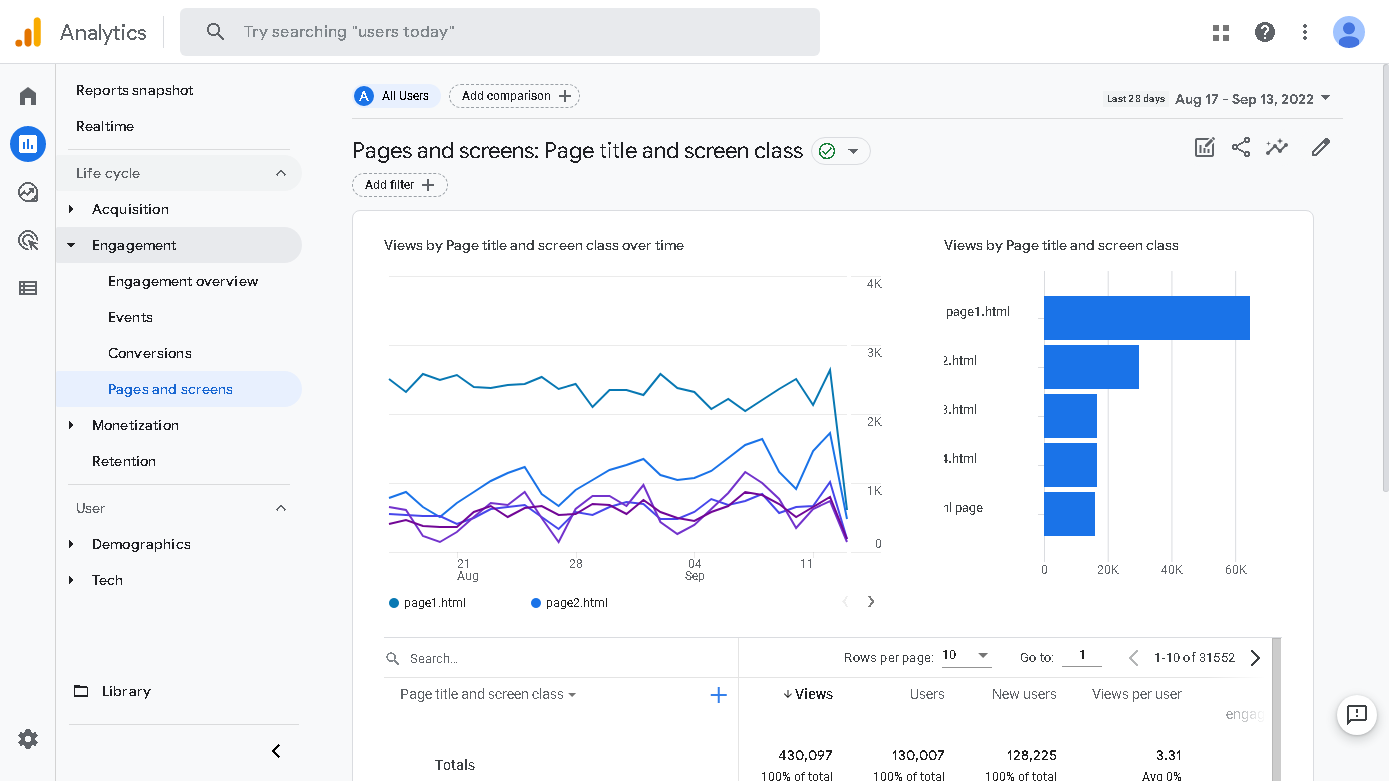
Pages and screens
The most important thing to look at under Engagement is the Pages and screens report. To view this report, click the Reports tab on the left of the Google Analytics interface, then click Engagement > Pages and screens.

The thing to look for on this report is that the traffic is diversified across multiple pages. You will often come across sites that are making a reasonable amount of money, but where all of that money is coming from traffic to one page.
It’s risky to buy a site that has most of its traffic going to one or a few pages. This is because Google algorithm changes (and they happen at least 2x a year) will affect the rankings of many pages on your site.
Imagine a scenario where 70% of the traffic to a site is to a single page, and that page is ranked #1 for an important search term. A Google algorithm update could easily make it drop to #5, which would be catastrophic for earnings.
As a buyer doing due diligence with Google Analytics, I would only be willing to purchase that site if the 70% of traffic was split over 10 pages, with no page getting more than 15% of traffic.
Ideally, however, I would want to see traffic even more diversified, with no pages (except maybe the home page) getting more than 5% of traffic.
Sudden jumps or drops in traffic
Another thing to look for using the Pages and screens report is any sudden drops or spikes in traffic.
Sudden drops could signal a manual Google penalty, which is something any website buyer should avoid. Sudden spikes may indicate paid traffic or some other black hat technique.
The best traffic pattern is a linear upward pattern, with some small dips or humps. If the site has a gradual downward traffic trend, the site has likely been hit with successive Google algorithm changes. While this is not ideal, the right buyer can usually turn such a site around.
I avoid any sites with sudden changes in traffic, but I am willing to buy sites with gradual downward trends, provided that they are valued correctly.
What to watch out for with Google Analytics
Now that we have gone through all of the reporting, and what to look for in Google Analytics, it’s vital to understand what to watch out for.
Sellers hacking Google Analytics
Google Analytics relies on the website it runs on to accurately report pageviews. What this means is that it’s possible, with some simple Javascript, to force Google Analytics to overcount traffic.
How does this happen? Let’s take a look at how Google Analytics records a page view (different versions of Google Analytics differ slightly, but the general functionality is the same):
When you install Google Analytics on a website, you get some Javascript code. The code looks like this:
...
ga("create", "UA-XXXXXXX-1", {"cookieDomain":"auto"});
ga("set", "anonymizeIp", true);
ga("send", "pageview");
...
Google Analytics records a pageview when that last command is sent. But there is no stopping that last command from being run twice (or 100 times) on a page. Google does this on purpose so that the site can accurately measure page views on more complicated sites (such as single page apps, where an entire user session would otherwise show up as one page view).
While the previous example was malicious, it’s possible to do make google overcount page views by accident as well. Suppose one administrator adds the Google Analytics code at the bottom of the page, and then another administrator comes along and doesn’t see the code at the top of the page.
That second administrator may then add the Google Analytics code at the top of the page. The two instances of the Google Analytics code would then register two pageviews for every one real pageview.
How to spot Google Analytics hacks during due diligence
The section above showed a simple way that Google Analytics can be hacked to inflate pageviews. The good news is that particular hack is relatively easy to spot. All you have to do is view the source of a page and look for multiple Google Analytics code sections.
Unfortunately, there are other hacks that are much more difficult to detect, which can also inflate users and sessions. For instance, a website owner may have two sites: one that he wants to sell and one that gets a lot of traffic. He can add the Google Analytics tags for both sites to the high traffic site.
To spot this type of hack, you can go into Google Analytics and add a filter using the Add Filter button and include the Hostname field (this example uses Google Analytics 4 — other versions will differ slightly). When you click the dropdown for Dimension values, you will see all of the websites that this tracking code was used on over the measurement period.
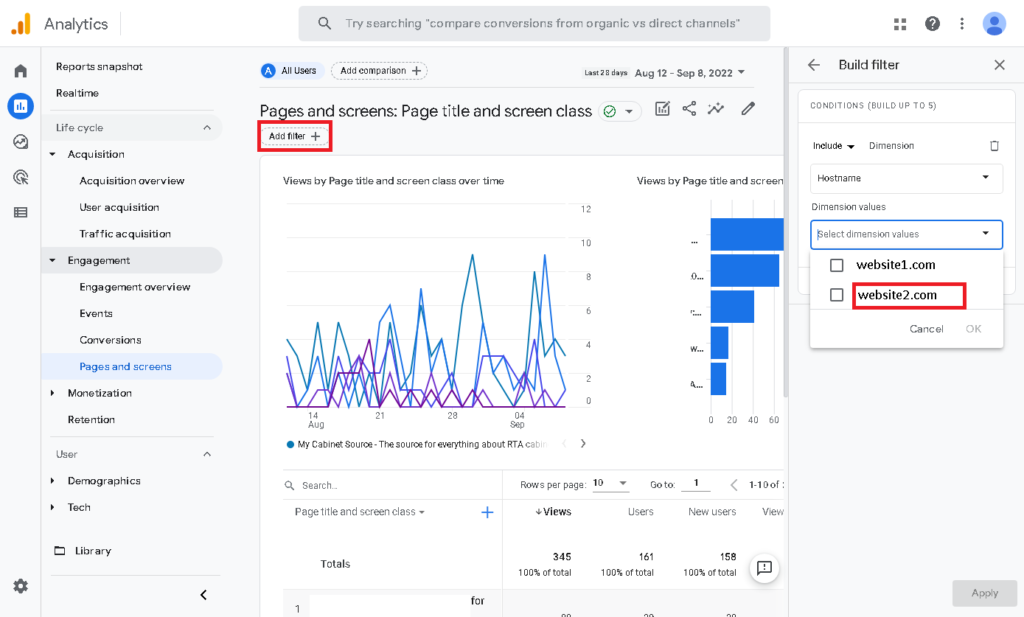
If you see any sites in that dropdown that are unexpected, something deceptive may be going on and you should follow up with the seller or broker.
Other hacks can be even more difficult to spot — the best advice to do proper due diligence is to carefully look through all of the Google Analytics reports and see if there is anything that looks strange. You can always follow up with questions if you’re unsure of something.
Download the complete Website Investing Beginner’s Kit FREE
If you’re looking at a website to purchase, my Due Diligence Overview worksheet is a crucial tool to help you make a decision. And it’s available FREE — all you have to do is sign up for my mailing list below. Along with great website investing content and tips, you’ll get the entire Website Investing Beginner’s Kit delivered to your inbox.
Key points
When performing due diligence with Google Analytics on a site you’re considering purchasing, make sure to check these:
- traffic should be diversified across many pages
- users should be located in a top tier country
- traffic should be from organic search, or you should understand where it is coming from